
GBP/USD currency trading recommendation 18 march 2016

march 18-GBP1|101trading.co.uk
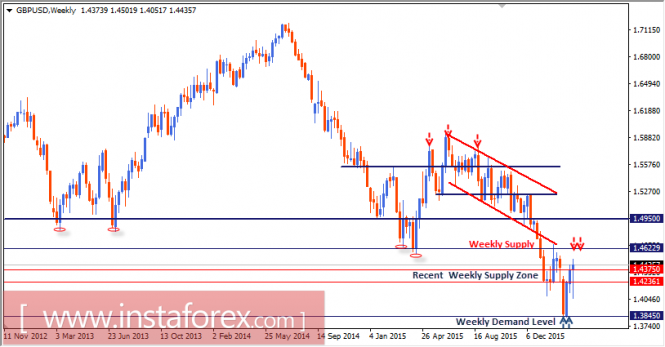
On January 21, after the GBP/USD pair moved below 1.4220, evident signs of bullish recovery were expressed around 1.4075. Hence, previous weekly candlesticks closed above 1.4220 and 1.4360 again.
Bullish persistence above 1.4360 was mandatory to maintain enough bullish strength in the market. The first bullish target was seen at 1.4615 where the most recent bearish swing was initiated.
As previous weekly candlesticks maintained their bearish persistence below the depicted demand zone (below 1.4200), the next weekly demand level was located at 1.3845 (historical bottom that goes back to March 2009).
As expected, an evident bullish recovery and a bullish engulfing weekly candlestick were expressed around 1.3850 (prominent weekly demand level). That is why, a valid buy entry was suggested near the same level.
The price zone of 1.4235-1.4375 constitutes a significant supply zone to offer evident bearish rejection.
This bearish rejection was manifested on the weekly chart until the price level of 1.4050 managed to push the pair again to the upside.
Note that bullish persistence above the price level of 1.4375 allows further bullish advancement towards 1.4620 to take place.
march 18-GBP2 |101.trading.co.uk
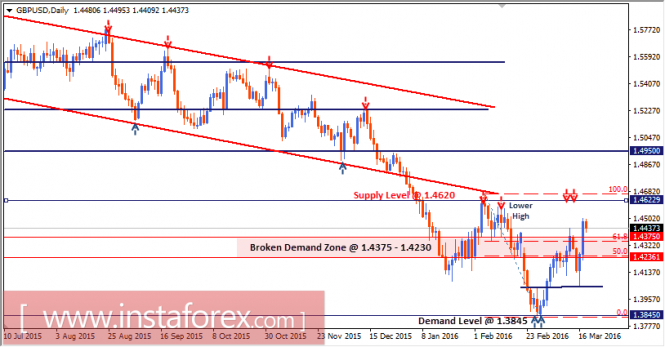
A recent lower high was achieved around the level of 1.4530. This applied extensive bearish pressure against the price level of 1.4235.
Hence, an extensive bearish breakout below 1.4235 was expressed on the daily chart (GBP/USD looked oversold few weeks ago).
That is why; signs of bullish recovery and a profitable long entry were expected around 1.3850. A recent bullish swing was expressed towards 1.4375.
On March 13, the broken demand zone (1.4235-1.4375) stood as a significant supply zone to offer bearish rejection in the short term.
A lack of bearish rejection around 1.4235 allowed further bullish advancement towards the level of 1.4375.
On March 14, evident signs of bearish rejection were expressed around 1.4375 (61.8% Fibonacci level).
That is why; a recent bearish movement was executed towards 1.4050 where the current bullish swing was initiated.
Today, the price level of 1.4375 (61.8% Fibonacci level) is being challenged again. Temporary bullish breakout is being manifested on the daily chart.
If bullish persistence above 1.4375 is maintained, a quick bullish movement towards 1.4530 and 1.4600 should be expected.
Otherwise, the GBP/USD pair will remain trapped between price levels of 1.4375 and 1.4150.

Michael Becker | Analytical Expert of Instaforex.com| 101trading.co.uk